Safari developer tools developer console, Inspect options
Why Are Safari Dev Tools Required?
In web application development, web developers need to test and debug functionality across different browsers. Chrome, Firefox, and Safari are among the most commonly used browsers.
Safari, developed by Apple, is a popular web browser.
Sometimes, functionality works in Chrome but not in other browsers like Safari. Developers need to debug the code to identify the root issue. All browsers provide developer tools for code debugging.
Configuring Web Developer Tools in Safari Browser
To enable developer tools:
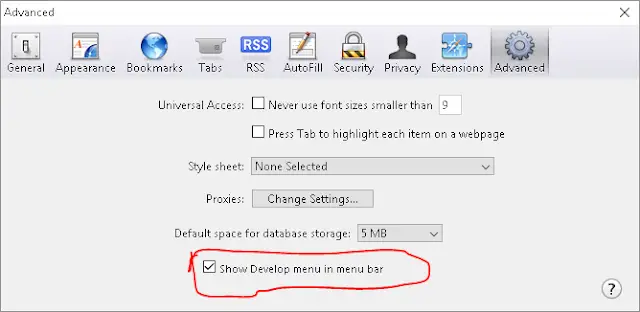
- Go to Safari -> Preferences -> Advanced Tab.
- Check the Show Developer menu in the menu bar option.

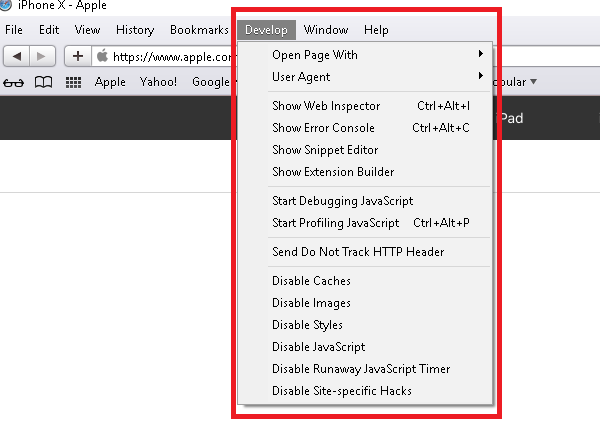
Once enabled, the Develop menu appears in the browser’s menu bar.
Develop menu is enabled in the menu of a browser as follows

Inspecting Elements in the Safari Browser
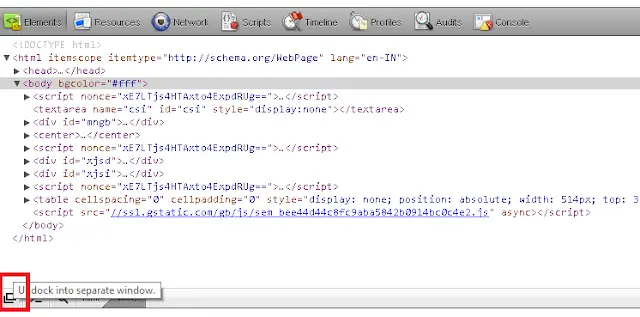
The Web Inspector is a crucial developer tool that offers various tabs to inspect frontend resources such as HTML, CSS, JavaScript, and the performance of network requests, including load times and console log messages. You can also inspect DOM elements.
To access the Web Inspector:
- Go to the
Developmenu. - Select the
Show Web Inspectoroption. - Alternatively, use the shortcut
Ctrl+Alt+Ito open the inspector window within Safari.
You can also open this inspect tool in a new window using a docking feature as below.

Displaying Error Console Feature in Safari Browser
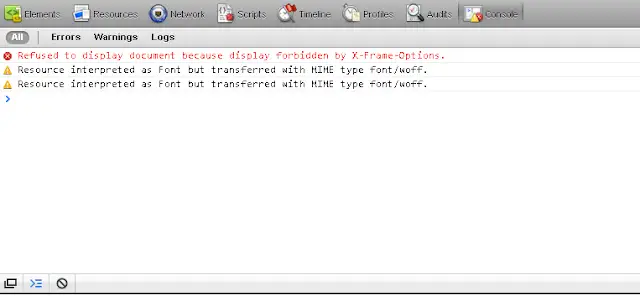
You can enable the error console feature using either the Develop menu or the shortcut Ctrl+Alt+C. This feature highlights broken elements and error messages in red on web pages, aiding in code debugging. Error messages are displayed with line numbers and helpful hints for issue resolution.

How to Preserve Log in Safari Developer Tools?
By default, Safari’s log is reset during page navigation. However, you can preserve the log:
In older versions: Select Keep Log on Navigation. In the latest versions: Use the preserve log option. In Safari 14 and newer versions, you can find the preserve log option in the Network tab of the Developer console.
For older Safari versions, right-click on the console area and select Keep Logon Navigation.
